POST data
1. Instrumentation on the Twin Otter aircraft during POST flights. Color Code indicates instrument performance: green data collected; yellow some data collected, red no data collected.
Instrumentation 
2. 50-hz POST Sc data of temperature T'(dT) and liquid water content LWC' differences between cloud holes and adjacent cloud unaffected by entrainment.
TO3 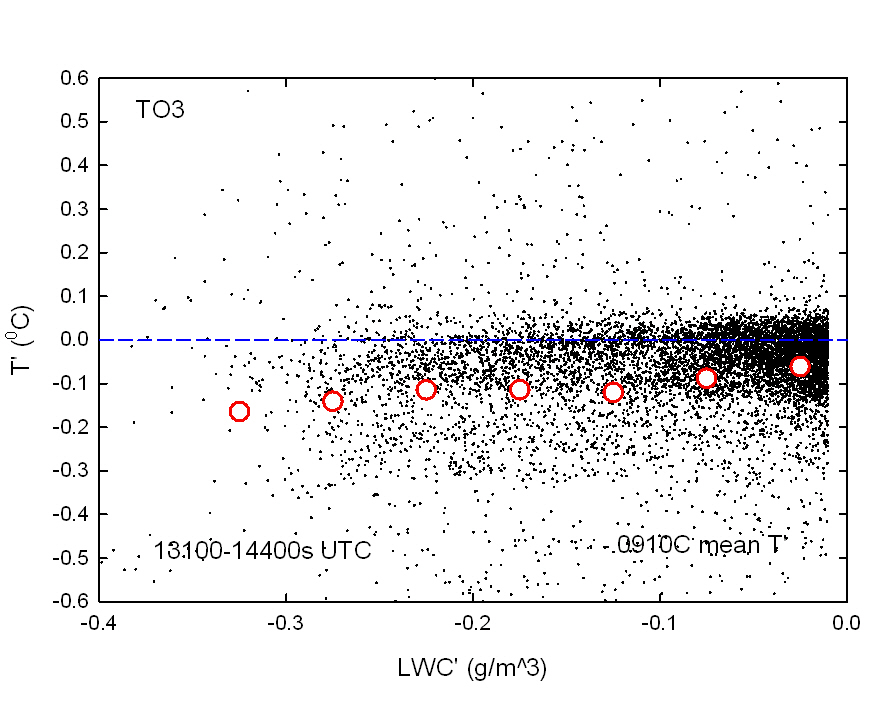 TO5
TO5  TO6
TO6 
TO8 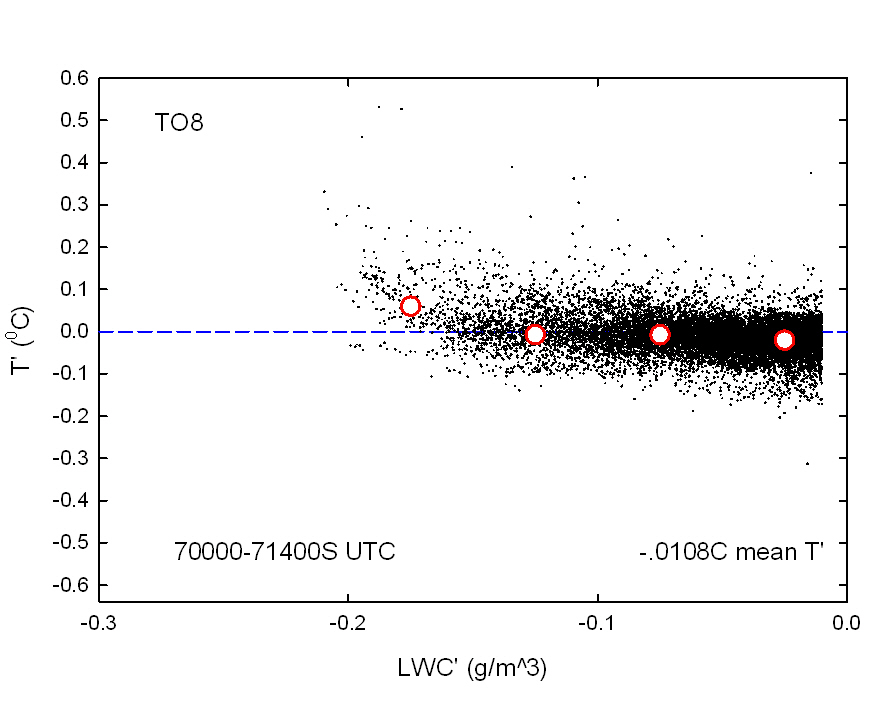 TO10
TO10 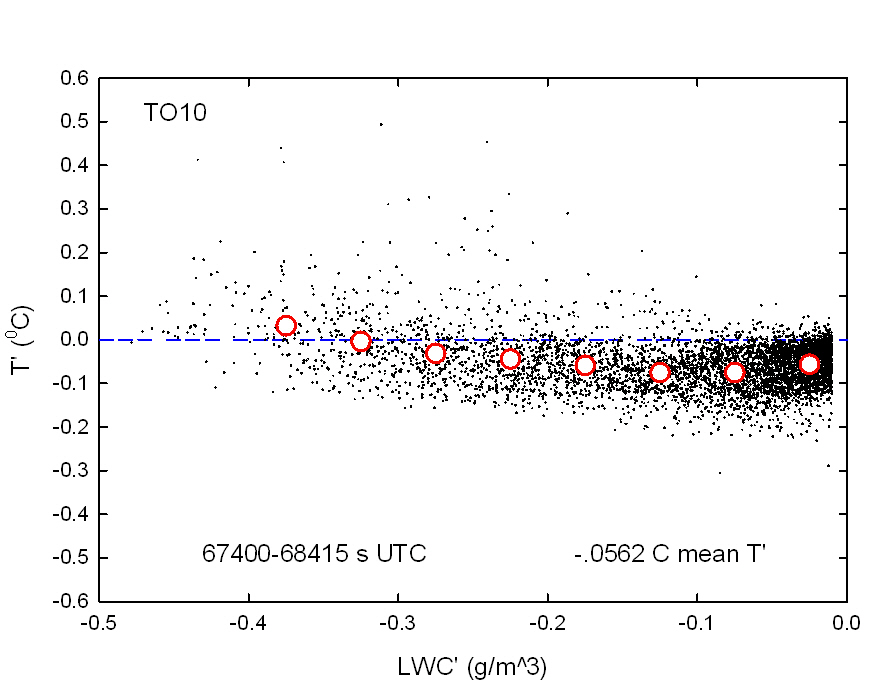 TO12
TO12 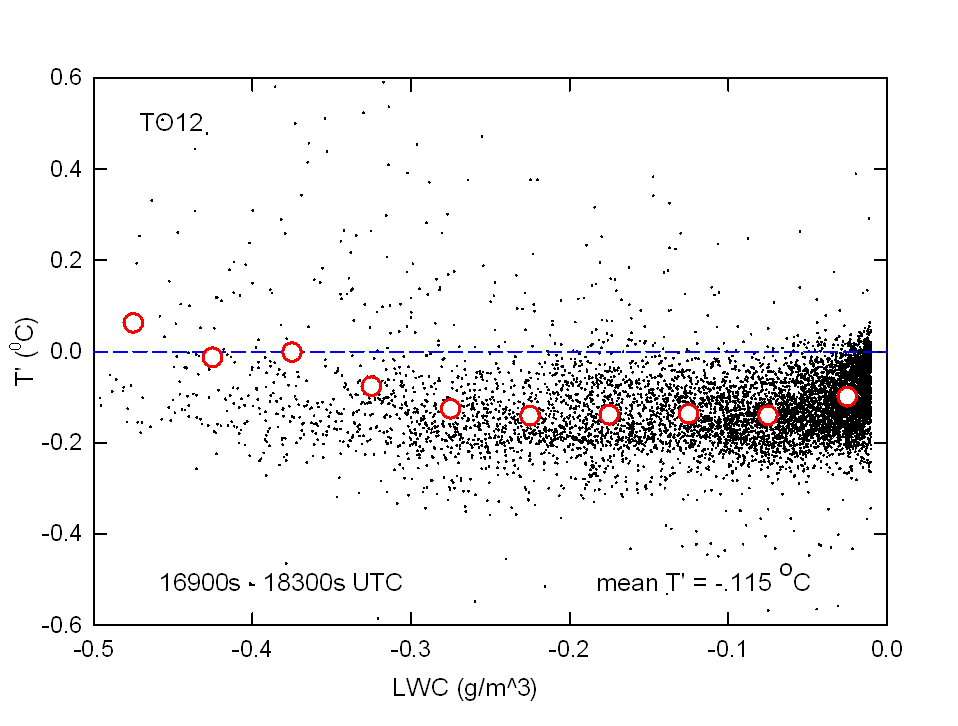
TO13 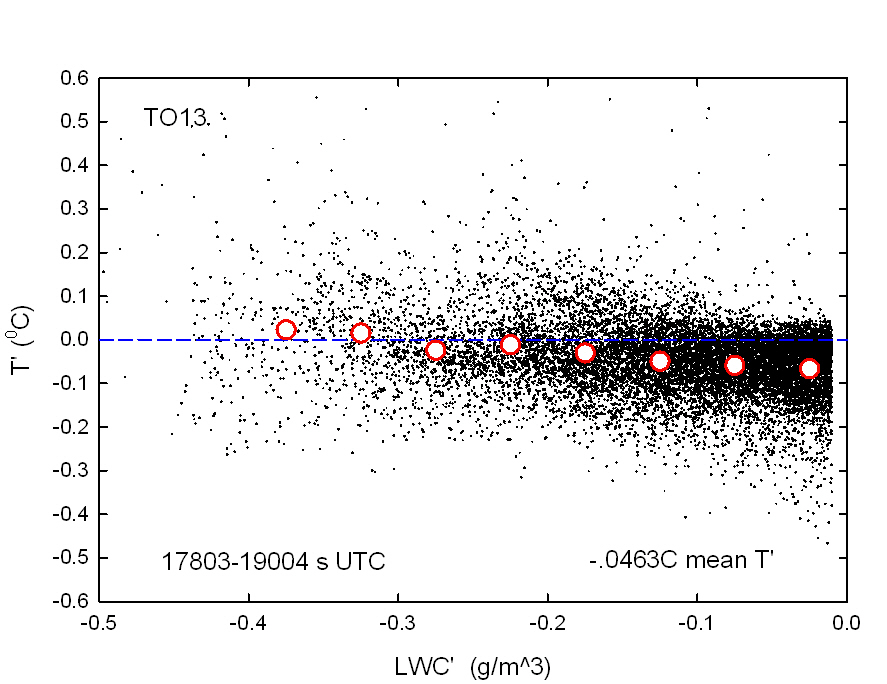 TO14
TO14 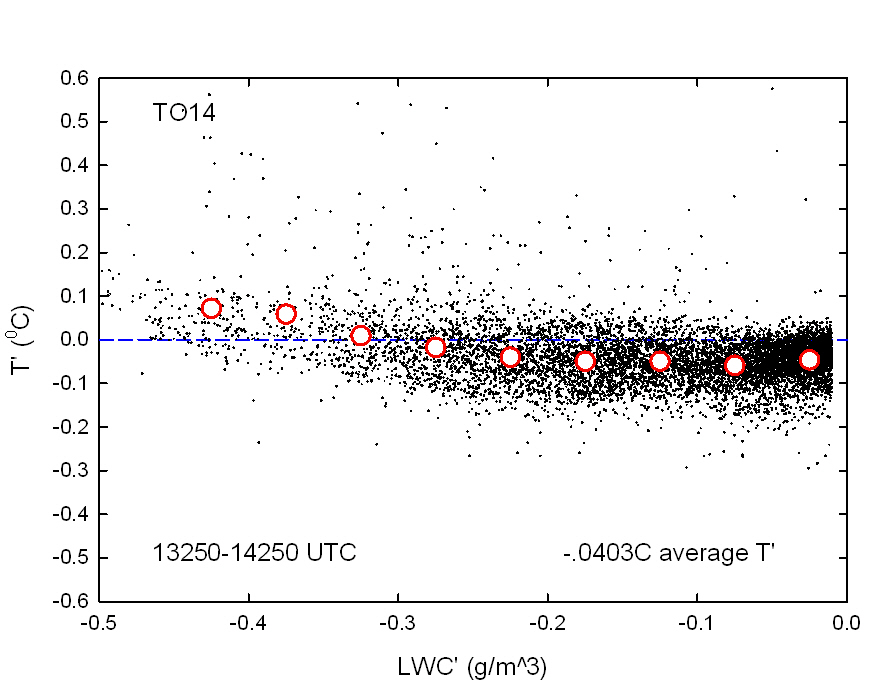 TO15
TO15 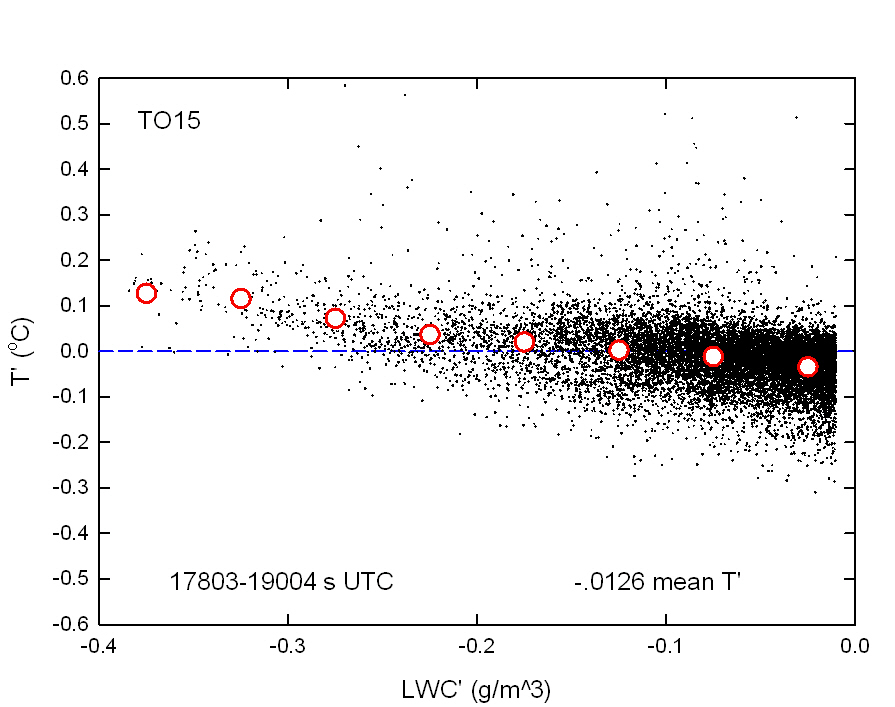
TO17 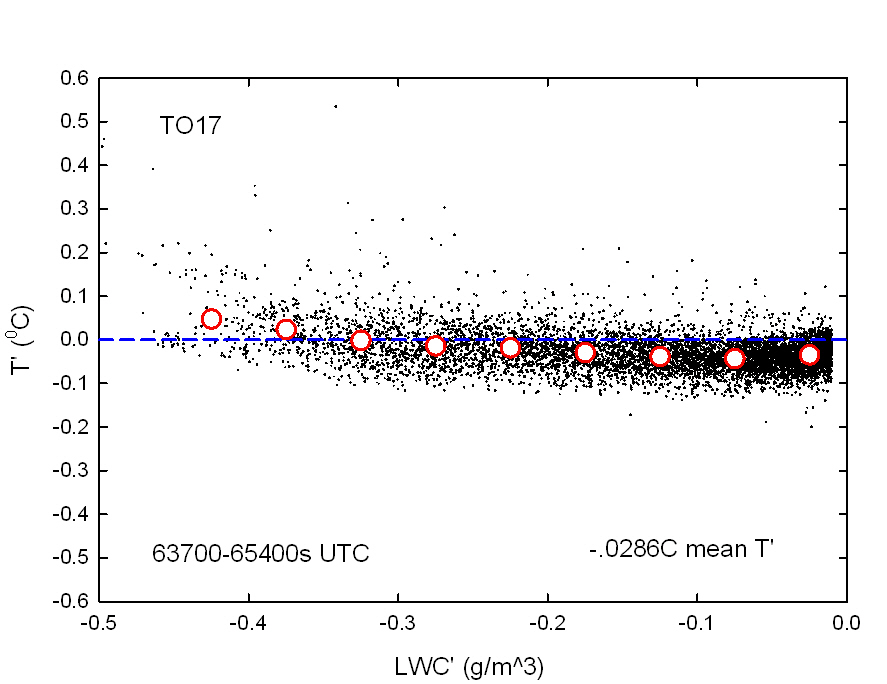
3. Average entrainment mass flux (Fe) of water in 10-m layers below cloud top. Horizontal lines indicate +/- one standard deviation of measurement variability.
FigTO1 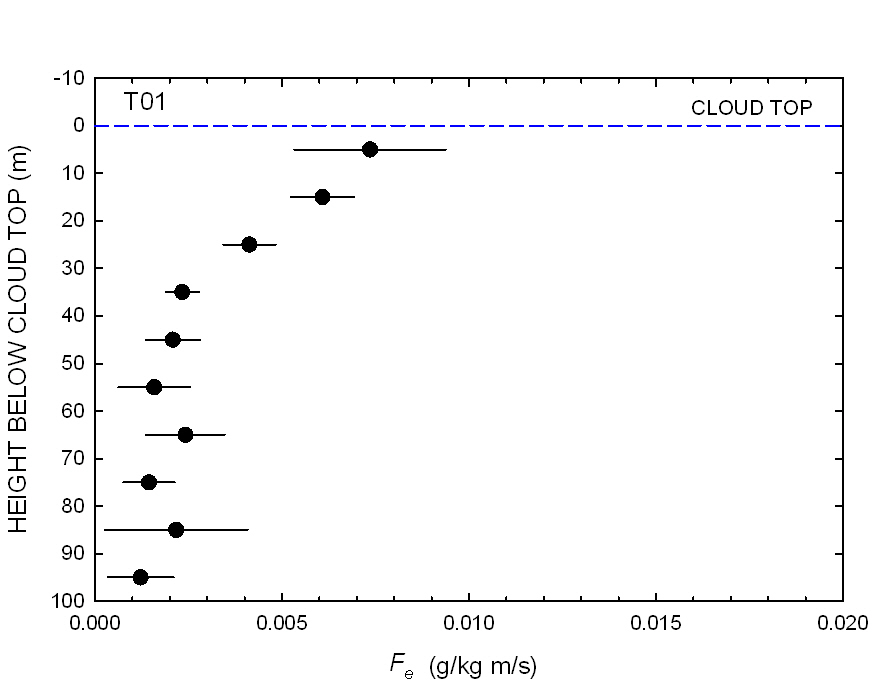 FigTO2
 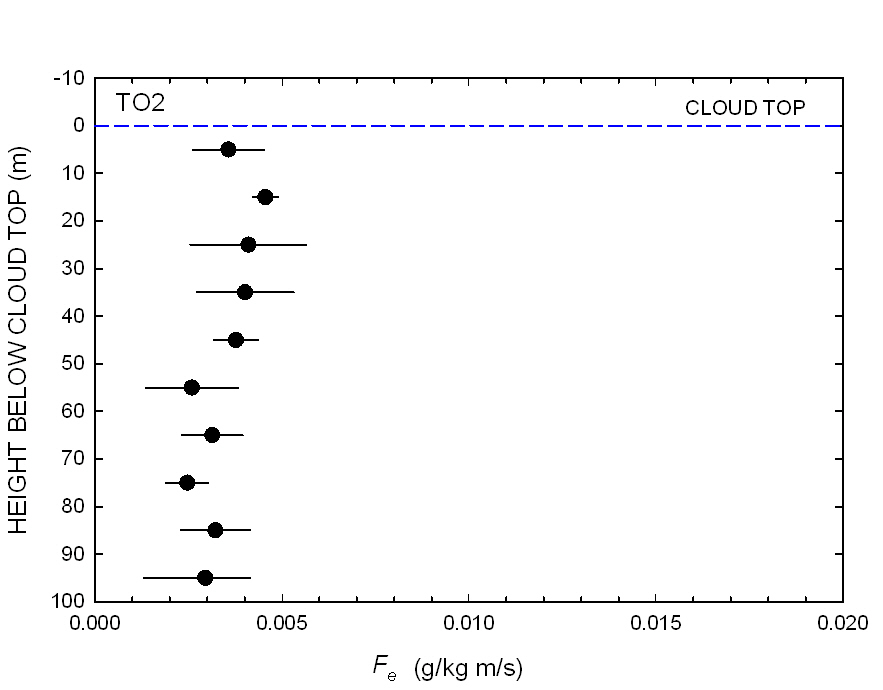 FigTO5
FigTO6  FigTO7
 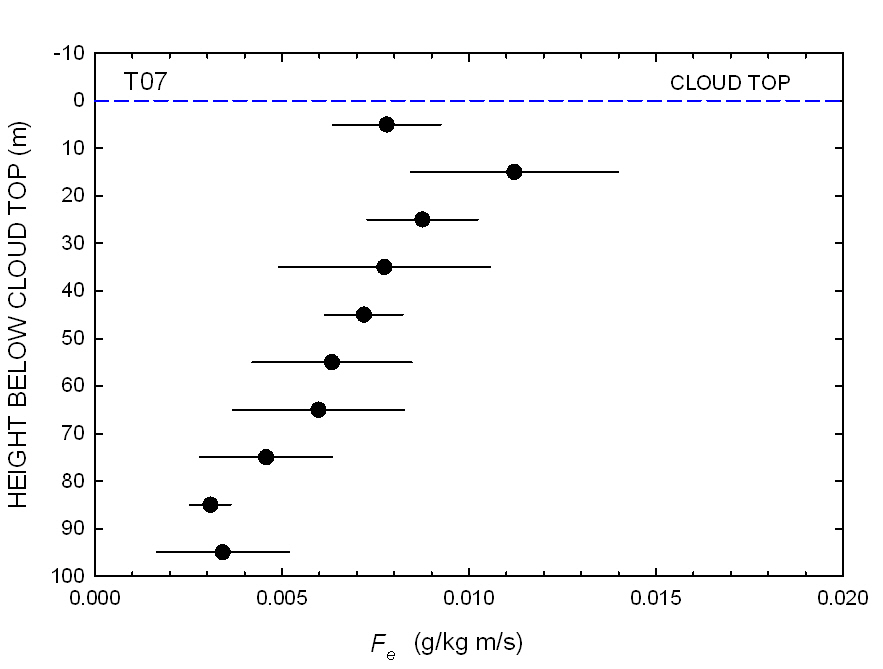 FigTO8
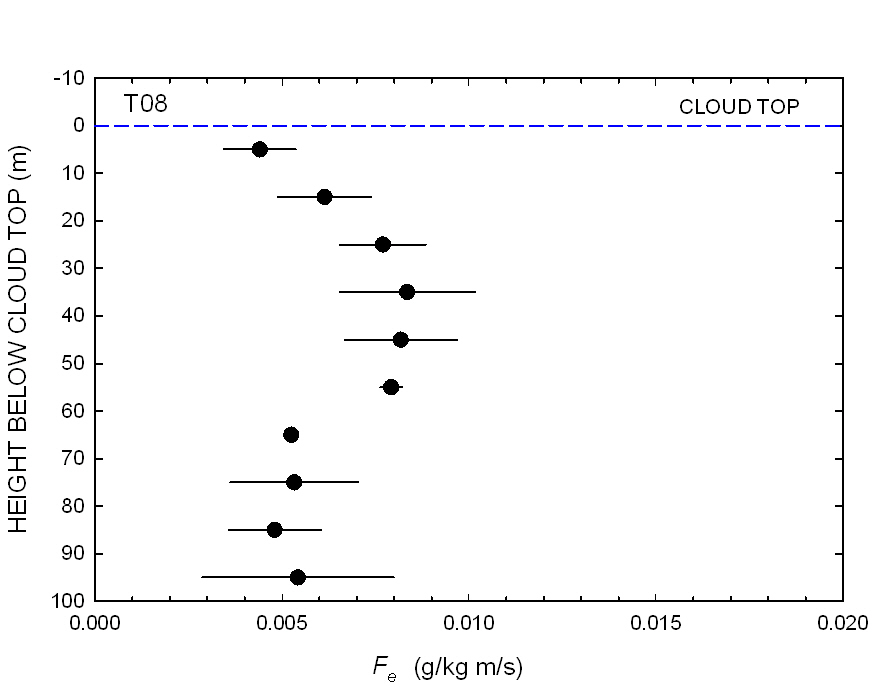
FigTO9 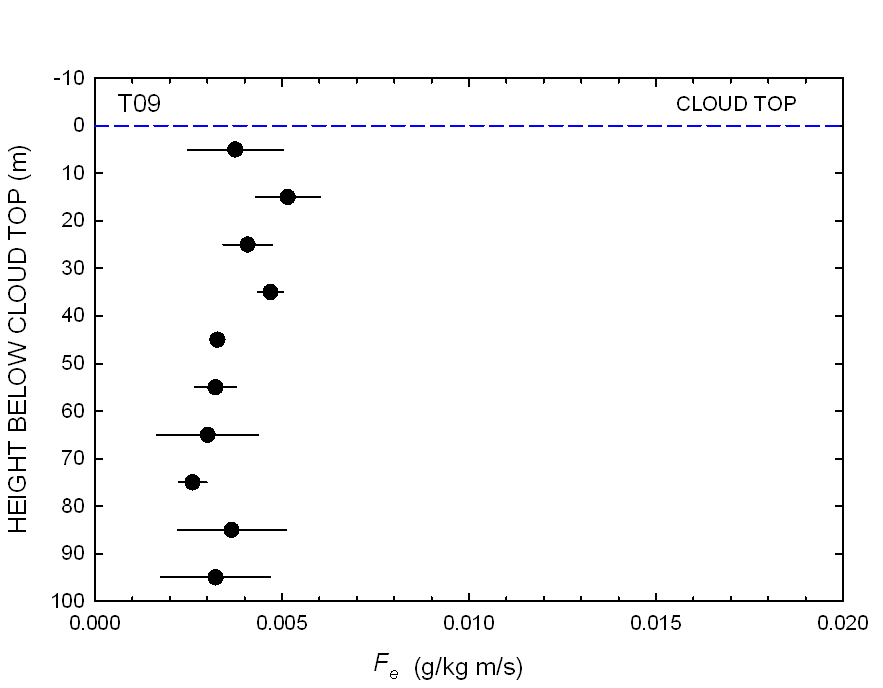 FigTO12
 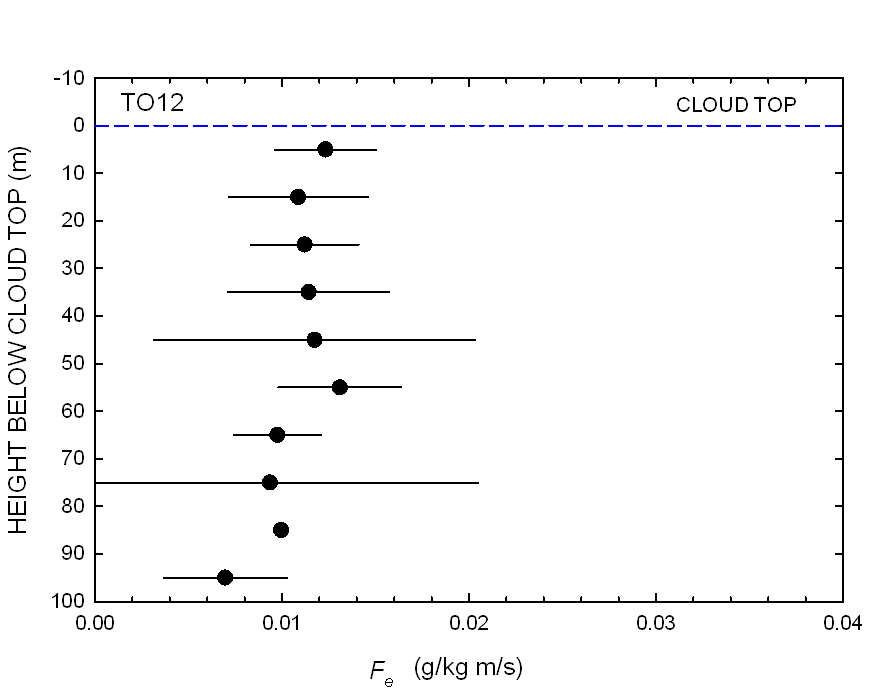 FigTO14
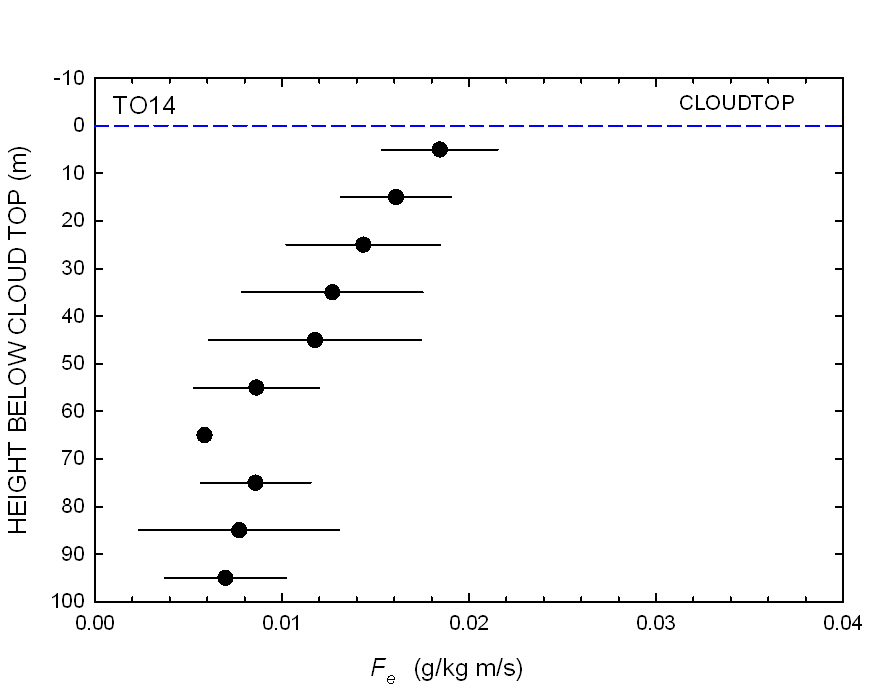
FigTO15 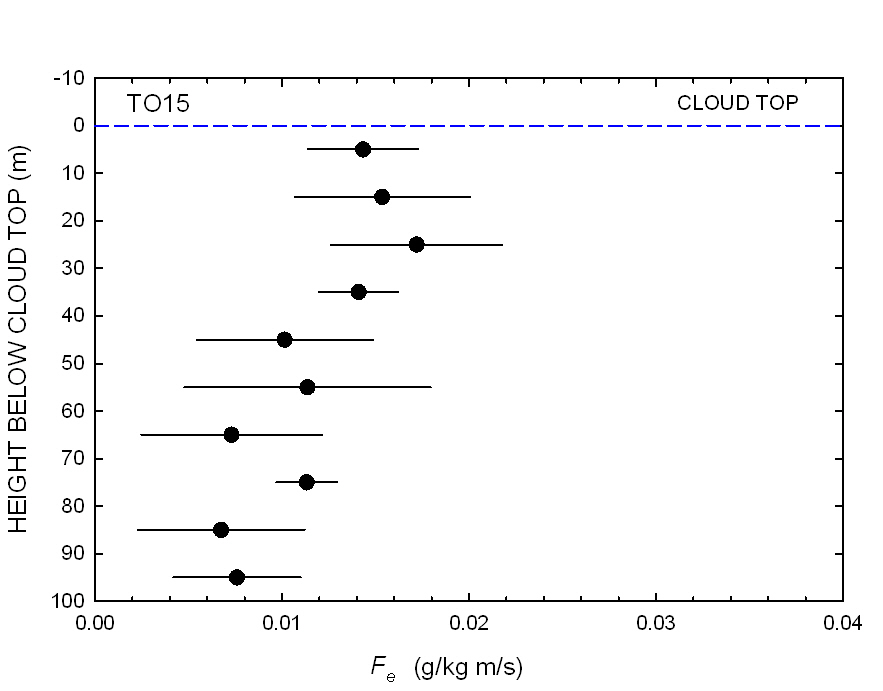 FigTO16
 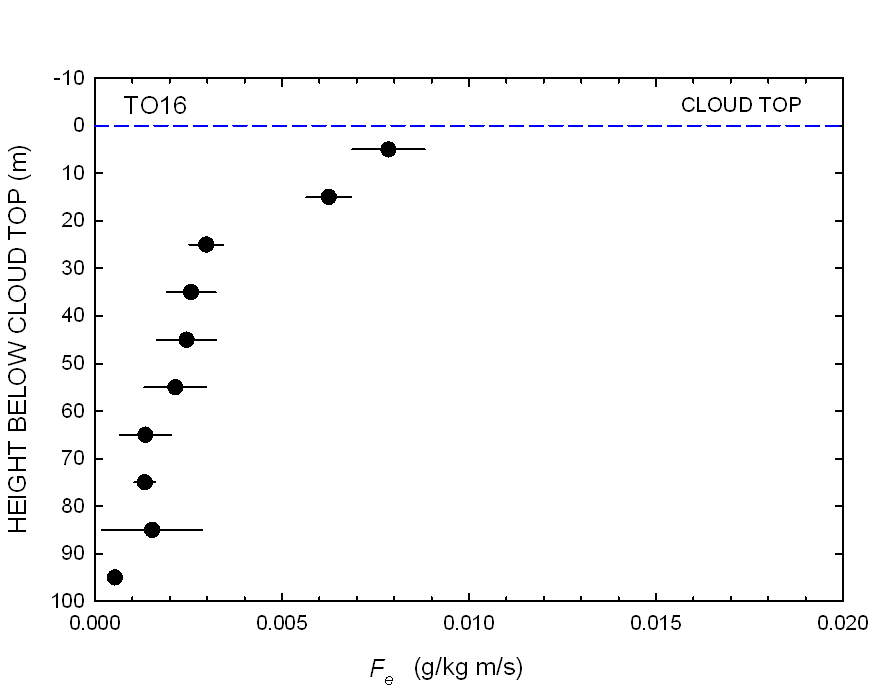 FigTO17
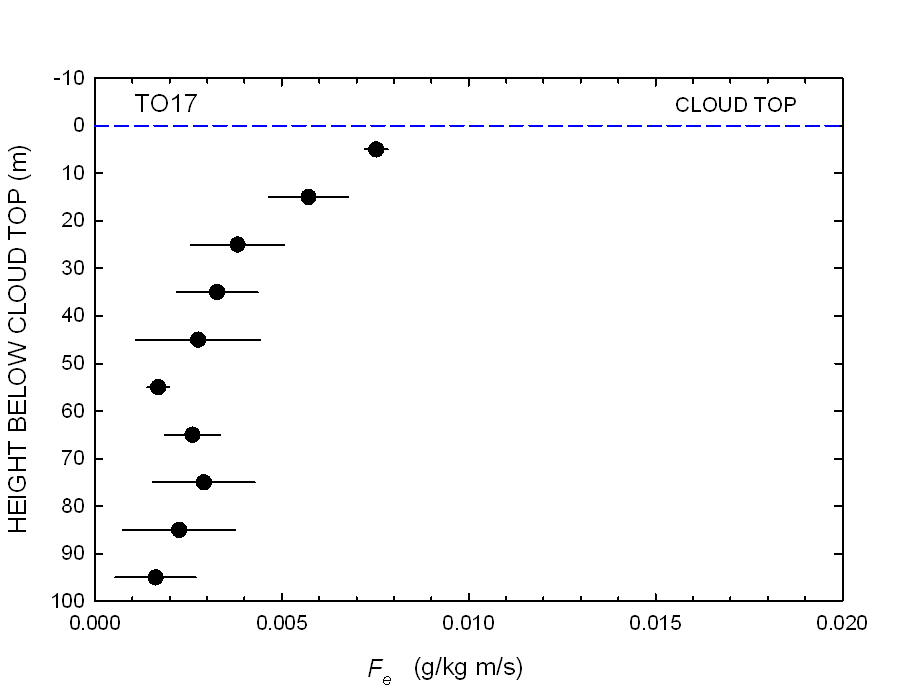
4. Cloud top as a function of Twin Otter flight time during the quasi-Lagrangian flight pattern.
CloudTopTO1  CloudTopTO2
 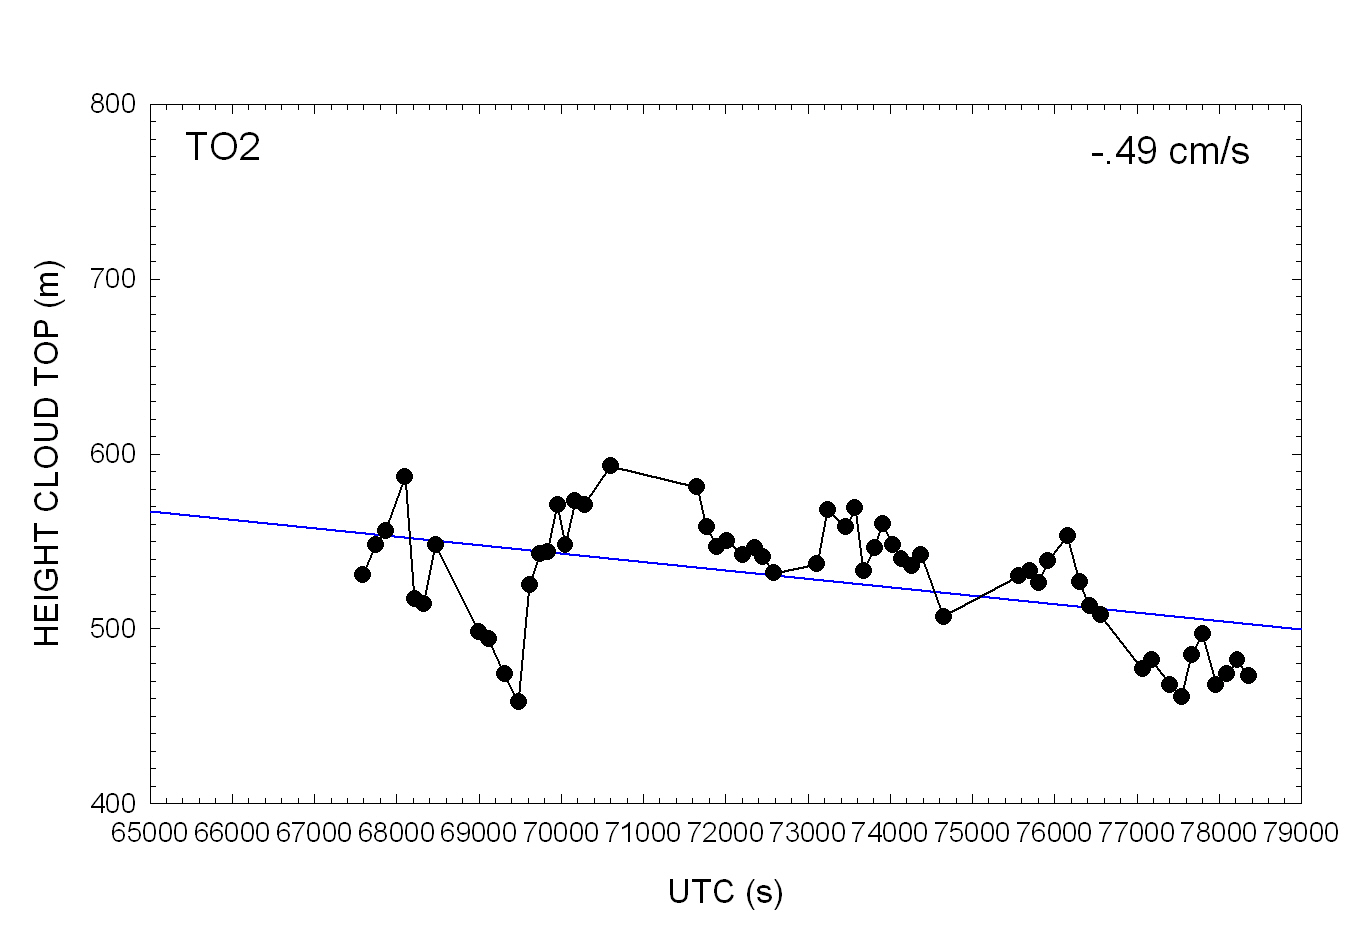 CloudTopTO3
CloudTopTO5  CloudTopTO6
 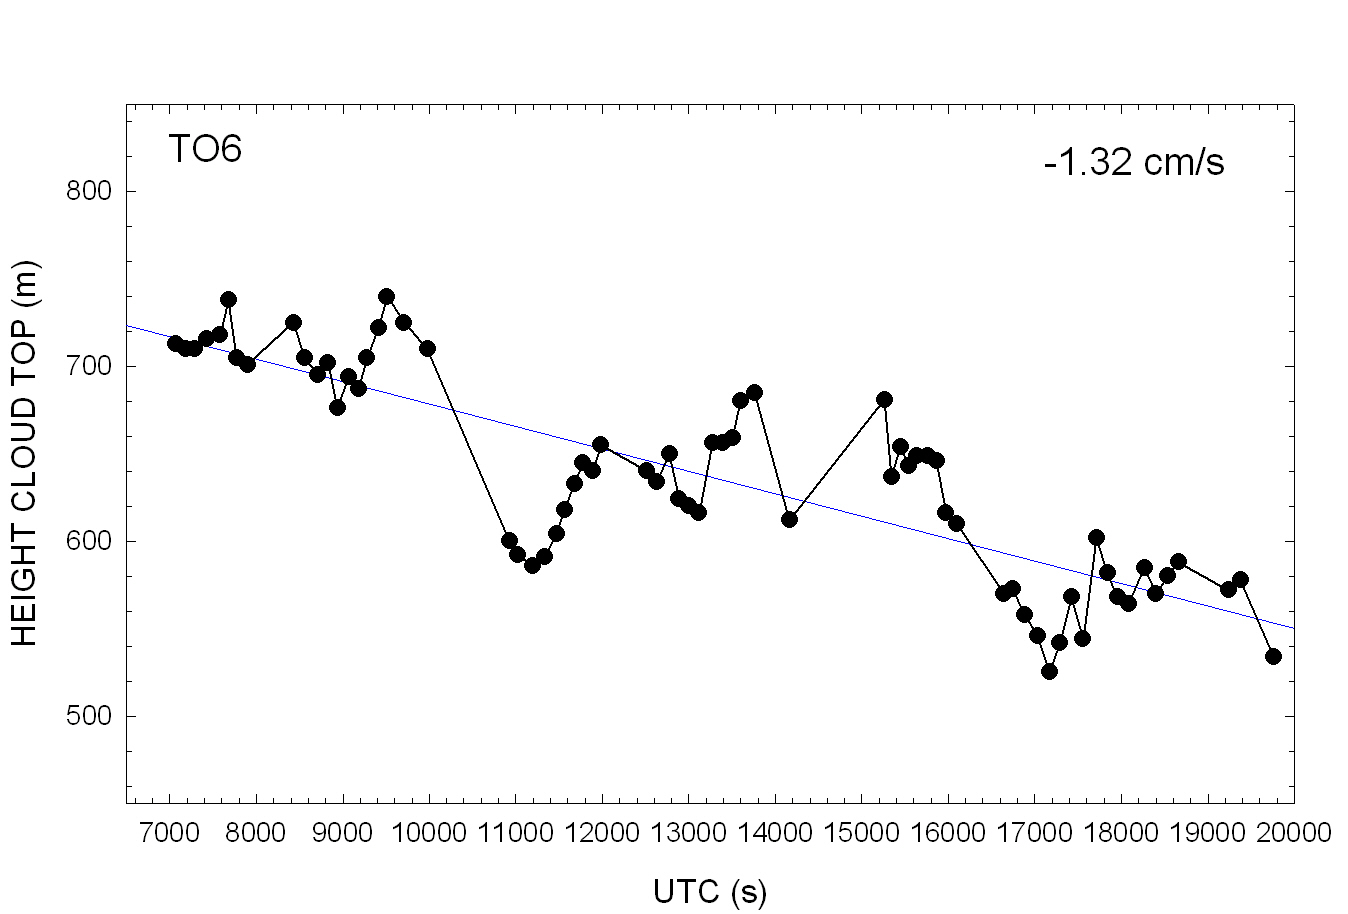 CloudTopTO7
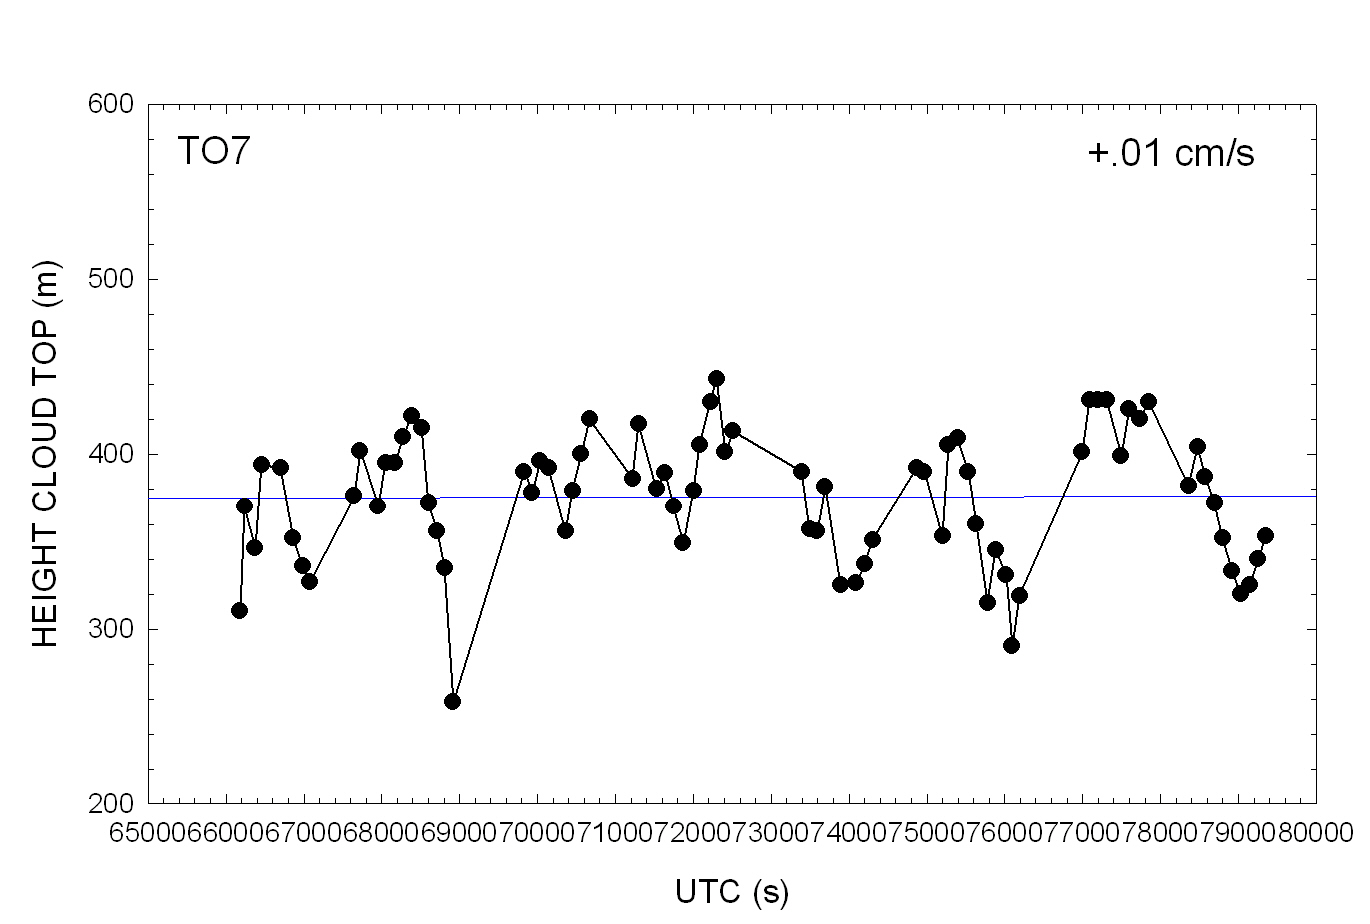
CloudTopTO8  CloudTopTO9
 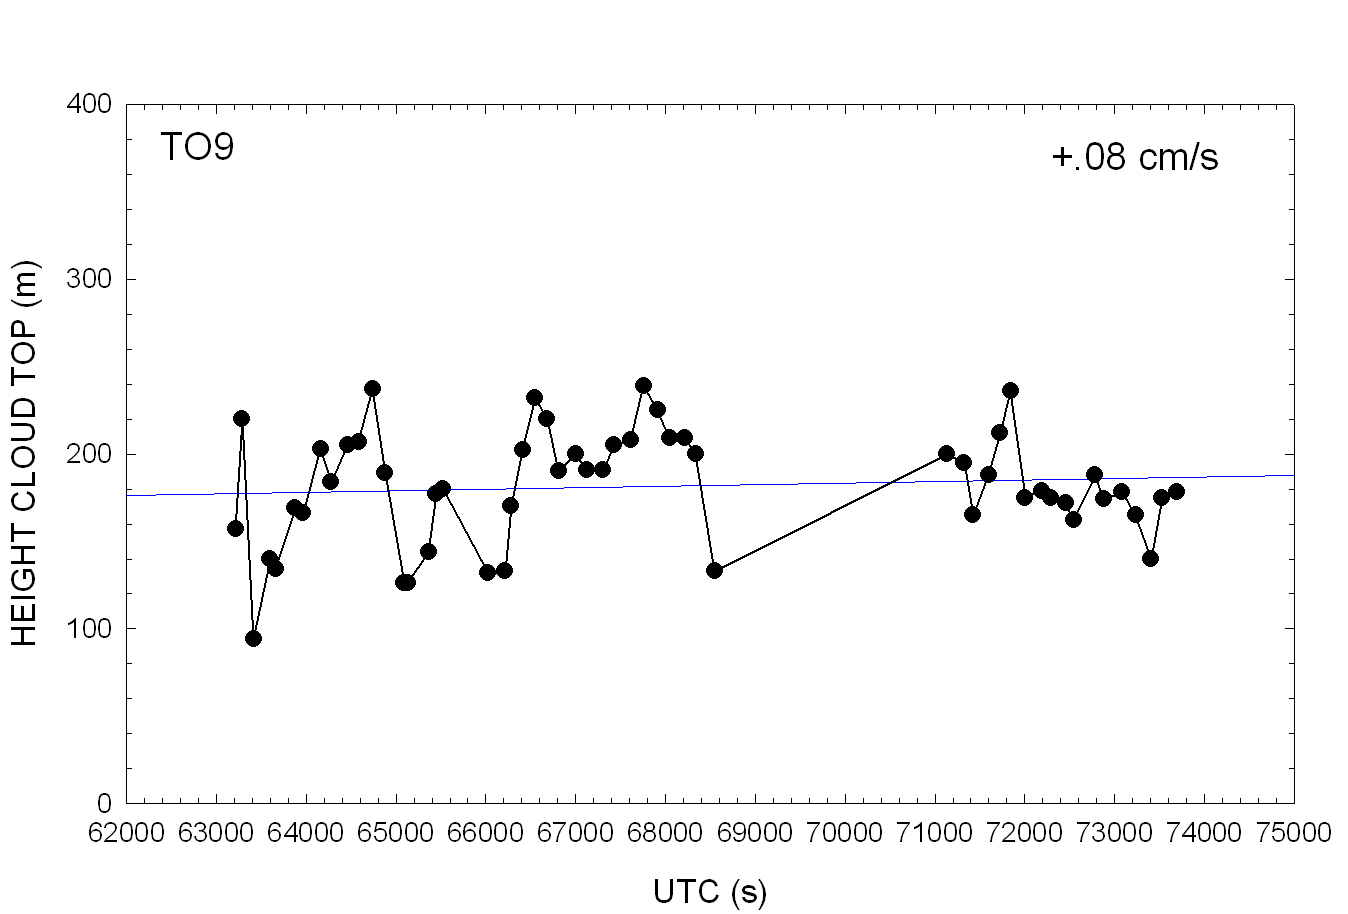 CloudTopTO10
CloudTopTO12 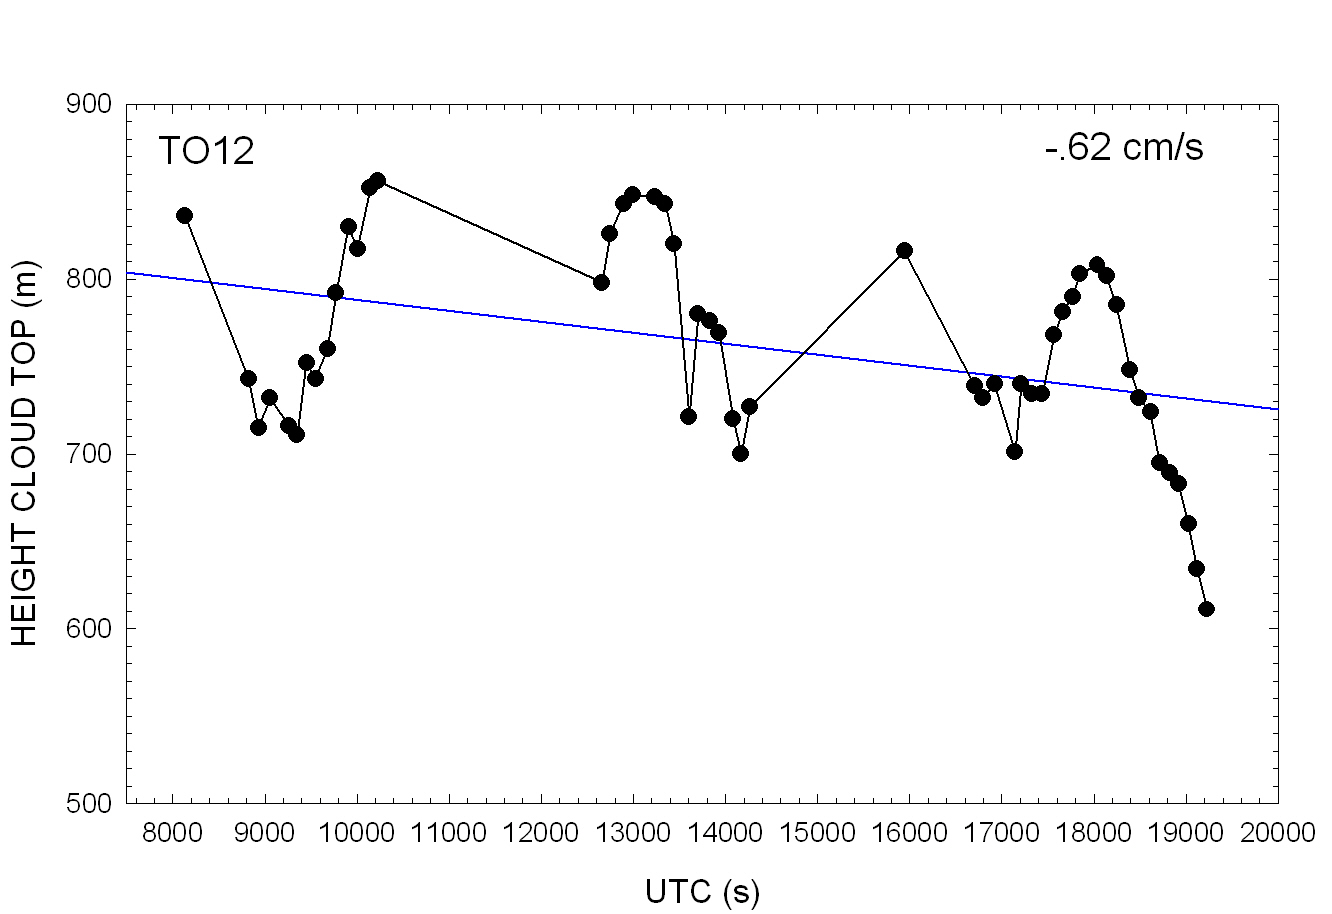 CloudTopTO13
  CloudTopTO14
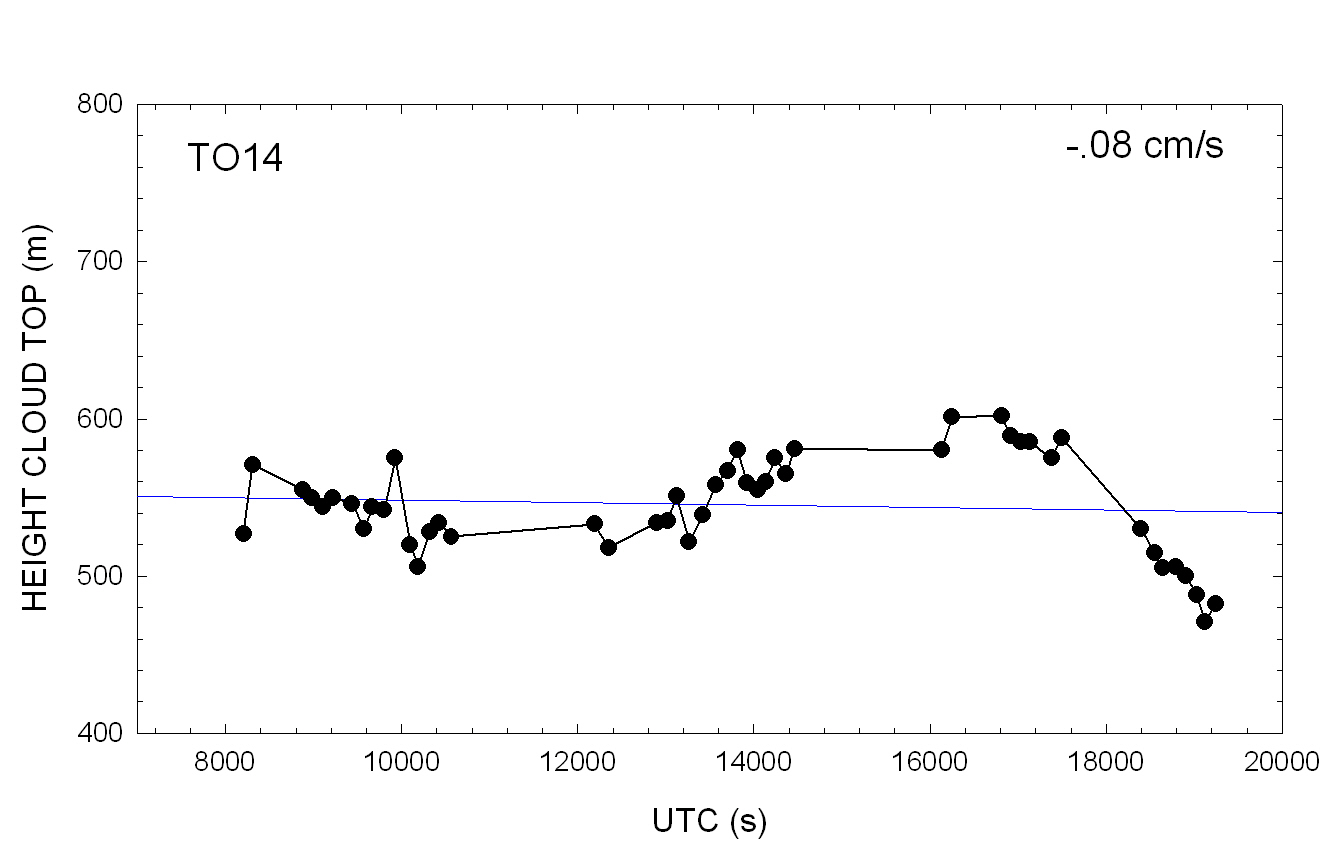
CloudTopTO15  CloudTopTO16
 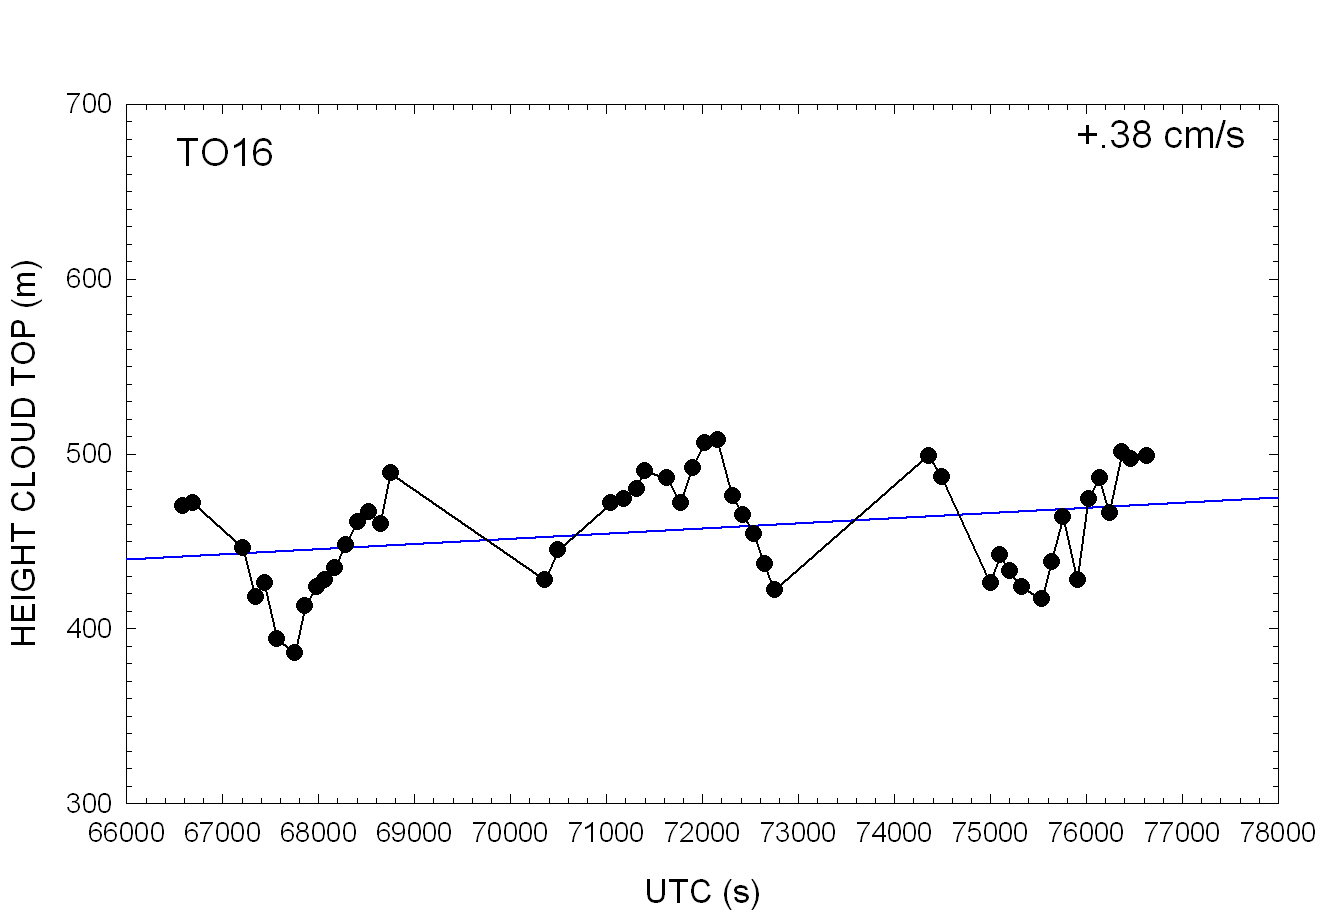 CloudTopTO17
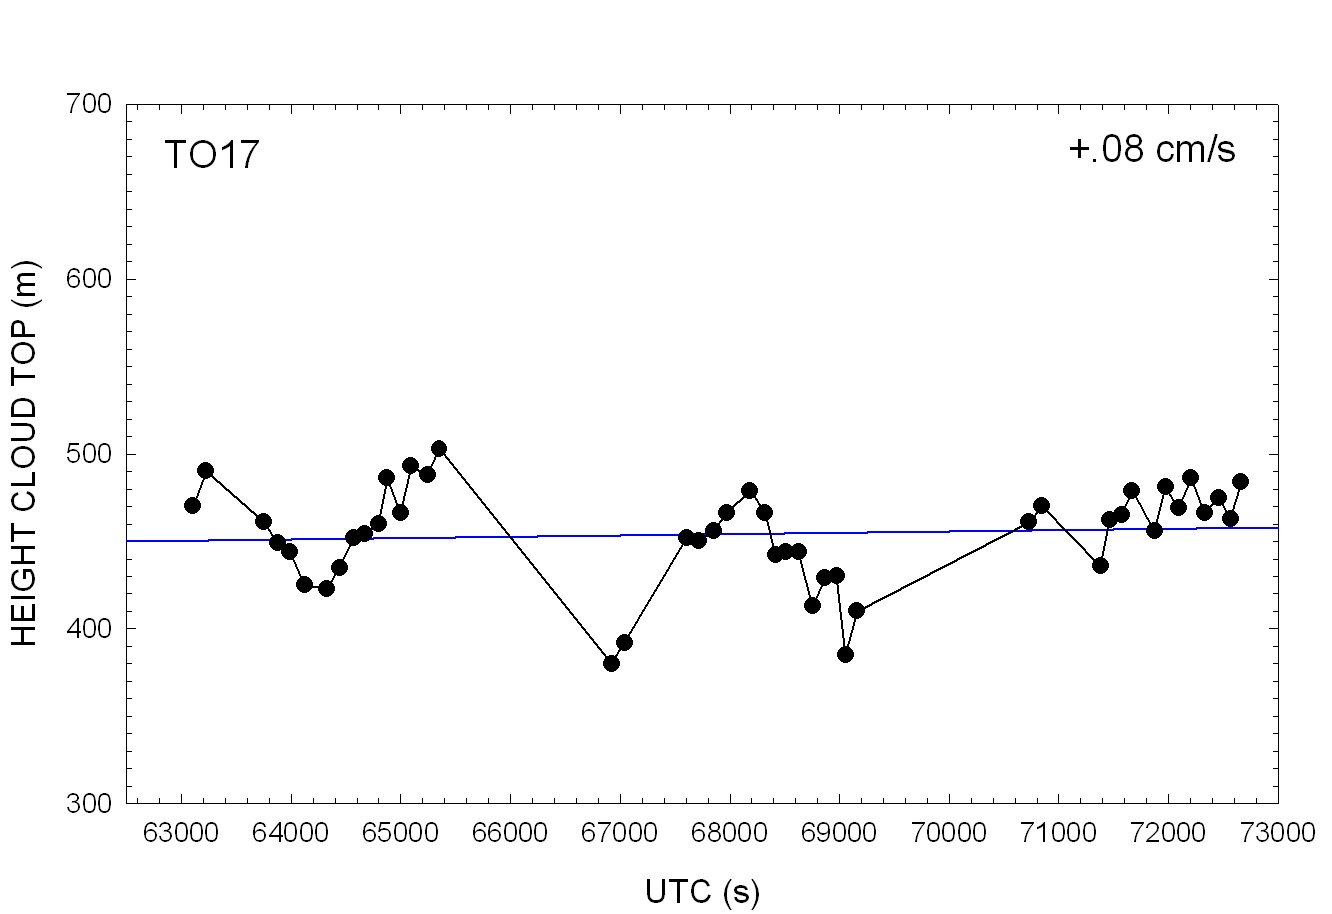
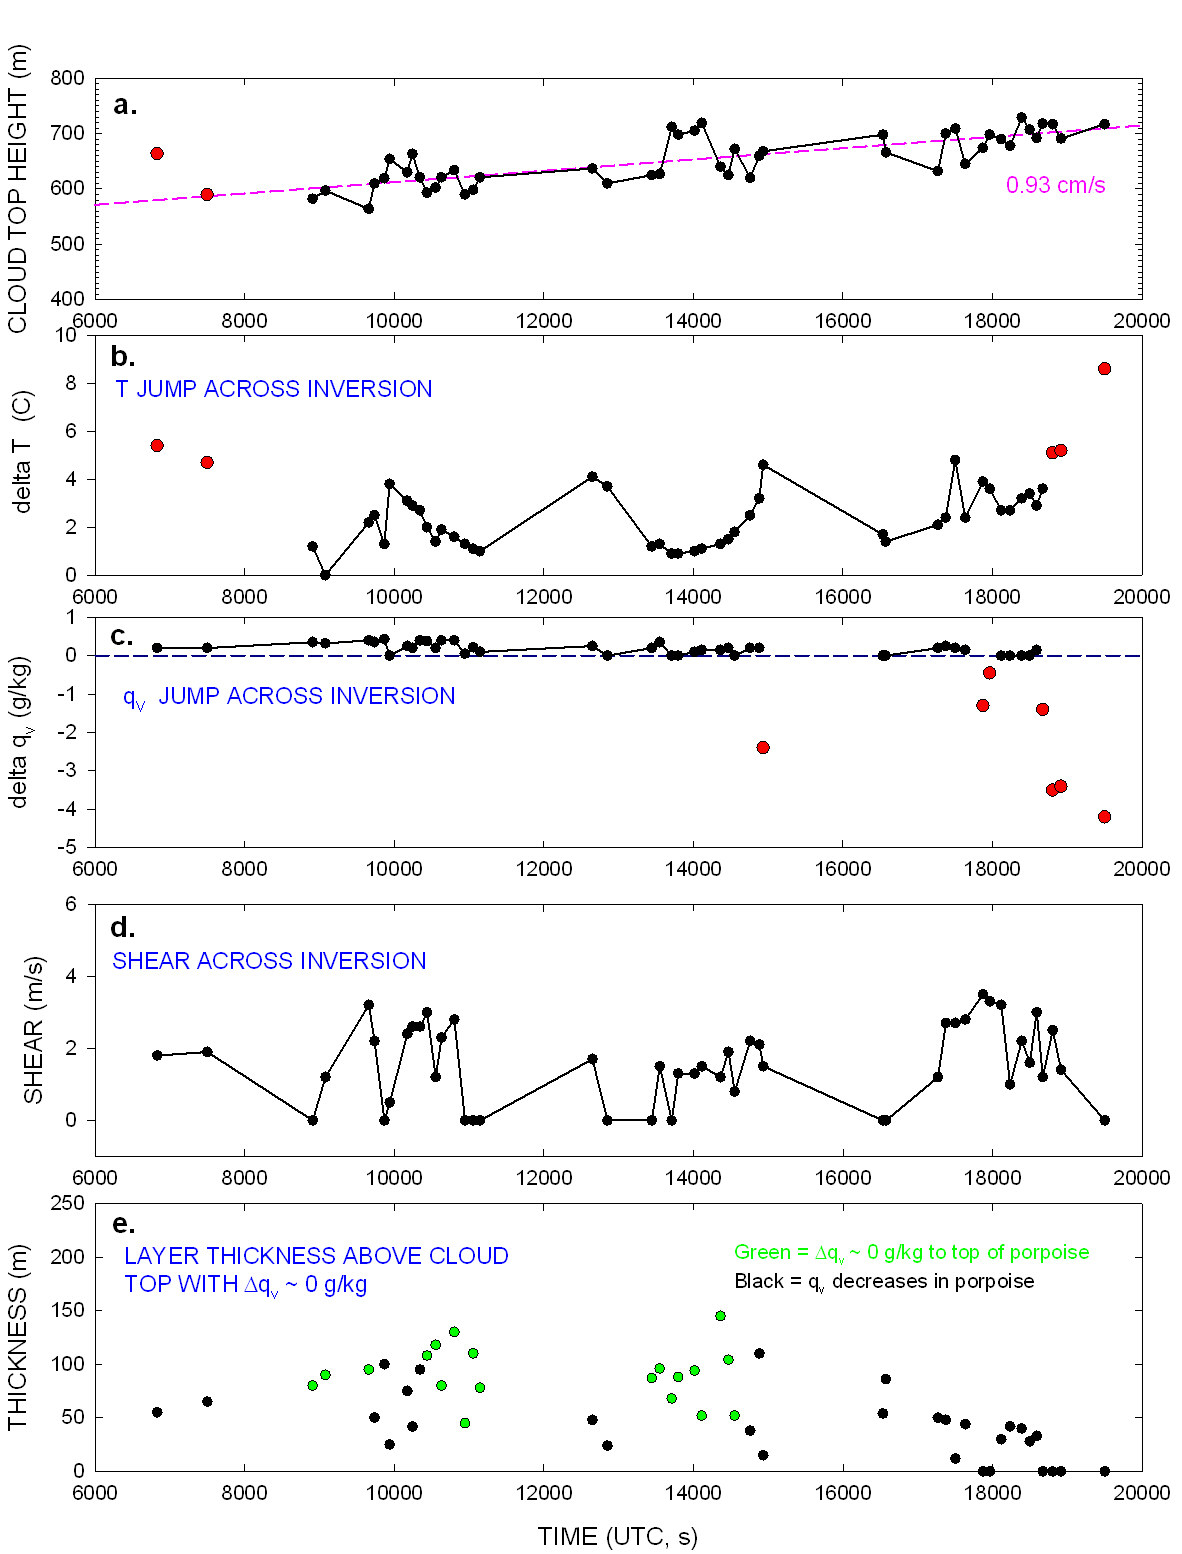
5. Details of flight TO13. Red data for delta T are outside the quasi-Lagrangian pattern. Red data for delta q_v are when the top of the aircraft porpoise saw drier air above the moist layer adjacent to cloud top.
TO13Details